


What is data visualization?
27-08-2025 80
In the digital data era, businesses not only need to collect and store information but more importantly, understand and exploit the value from data. By converting dry, complex numbers into vivid charts, graphs, maps or dashboards, data visualization helps users easily identify trends, detect abnormalities and make accurate, timely decisions.
In this article, Intech Group will share the most useful information about data visualization to help you have a comprehensive view to successfully apply it in your business.
What is data visualization?
Data visualization is the process of representing data using visual elements such as charts, graphs, maps, dashboards or infographics. Instead of just looking at dry and difficult-to-understand numbers, visualization helps convert raw, large or complex data into visual information that is easier to receive and analyze.
Thanks to data visualization, users can quickly recognize trends, patterns, detect anomalies in data, make accurate and timely decisions based on specific evidence.
Current data visualization tools not only support the creation of charts and visual reports but also automate the analysis process to ensure accuracy, detail and continuous updates, businesses can easily exploit in-depth information, optimize operations and improve management efficiency.
Why is data visualization important?
In the digital age, modern businesses have to deal with huge volumes of data coming from many different sources, including: internal and external websites, smart devices in manufacturing, internal data collection systems, social networks and online channels.
However, raw data is often difficult to understand, fragmented and difficult to exploit value if it is only in the form of numbers or statistical tables, at which point the role of data visualization is extremely important.
Data scientists and analysts will process, prepare and present data in an accessible visual context. By converting data into visual elements such as charts, graphs or dashboards, businesses can clearly identify relationships between data sources, detect hidden patterns and trends in the data, and easily communicate information to management teams and employees.
More importantly, data visualization not only helps businesses improve their business intelligence capabilities but also supports quick and accurate decision making and strategic planning based on practical data.
What are the benefits of data visualization?
Data visualization brings many practical values to businesses in the digital age. Here are the specific benefits it brings to businesses:
Support strategic decision making
Leaders and stakeholders can quickly grasp the big picture thanks to data visualization. Instead of spending hours analyzing complex spreadsheets, they can easily identify patterns, trends, potential opportunities and risks in data, helping businesses make more accurate and faster decisions and always maintain a competitive advantage in the market.
Improve customer service
Through visual charts and reports, businesses can easily identify customer needs, desires and behaviors. Data visualization helps detect gaps in current services, thereby strategically adjusting products or customer care processes, while minimizing inefficient operations.
Increase internal engagement and collaboration
Ability to communicate analytics to multiple employees at once. Teams can look at charts and dashboards together to set goals, track progress, and make plans for improvement. For example, sales teams can track quarterly sales using bar charts, creating transparency, increasing motivation, and fostering collaboration for better results.
Components of Data Visualization
To make data visualization work effectively, data scientists often combine three main components: message, data, and visualization. These three elements are closely linked, helping to transform complex raw data into understandable and valuable visual information.
Message
Before starting, data scientists often work with stakeholders to clearly define what they want to achieve through effective data analysis. For example, it could be measuring key performance indicators (KPIs), predicting sales, or assessing customer satisfaction.
Data
After defining the message, analysts choose the most appropriate dataset to convey the desired content. This process often includes cleaning the data, removing outliers, standardizing the format, and mining hidden information. A well-crafted and accurate dataset makes visualizations more credible and useful.
Visualizations
A visualization is a visual representation of data, such as a bar chart, pie chart, line graph, heat map, or dashboard. Choosing the right visualization is crucial to communicating your message to your audience. The goal is to highlight important data points, simplify complex data sets, and provide a comprehensive, easy-to-understand view.
Steps of the Data Visualization Process
To implement effective data visualization, businesses need to follow a systematic process of 5 steps as follows:
Define the goals
Businesses need to ask specific questions that data can answer, from which they need to determine the type of data to collect, the appropriate analysis method, and how to visualize effectively. For example, a retailer may want to know which type of carton brings in the most revenue to optimize their business strategy.
Collect data
After defining the goals, businesses need to collect data from different sources, including internal and external. Existing data stores such as sales history, marketing data, customer feedback, or online market data will be an important foundation for analysis. For example, synthesizing sales data and product packaging information helps determine the most effective carton type.
Data Cleaning
The process of cleaning data includes removing redundant information, filtering irrelevant data, standardizing formats, and removing outliers. For example, you can exclude sales data during special promotions to get a more accurate view of product consumption trends.
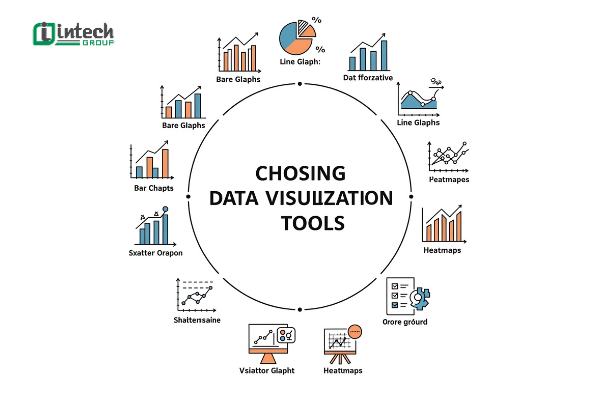
Choose a data visualization tool
Each type of data and goal will be suitable for a different visualization tool. Common tools include bar charts, pie charts, line graphs, heat maps, or dashboards.
- Interactive visualization: allows users to change variables, interact directly to exploit more information
Create data visualization tools
Businesses use data visualization tools to create visual products for analysis and reporting. These tools typically allow you to import processed data and automatically generate charts or reports. To be effective, follow these design principles:- Làm nổi bật chi tiết quan trọng bằng màu sắc, kích cỡ và phông chữ.
- Highlight important details with color, size, and font.
- Ensure context is clear with visual cues.
- Choose an intuitive, easy-to-read color palette.
- Use explanatory headings to guide the viewer.
- Provide clear labels and metrics to make information easy to understand.
Popular Data Visualization Tools
Charts and graphs are the most common methods, but data visualization has many different techniques, suitable for each need of analysis and information presentation. Here are 5 popular types of data visualization techniques:
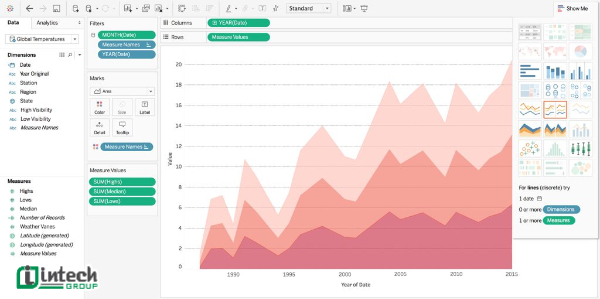
Time series data visualization
This is a technique used to represent changes in data over time. Common visualization types include line graphs, linear charts, or timelines. For example, use a line chart to show the sales trend over 12 months. If the chart has multiple lines, they will show the changes of different factors over the same time period.
Hierarchical data visualization
This technique is often applied to represent data with a parent-child structure. Common types are tree diagrams or sunburst charts. For example, you can visualize inventory in a hierarchical manner: the parent node is “Clothes” and the child nodes are “Shirts”, “Pants”, “Shoes”, making it easy to grasp each category.
Network Data Visualization
Network data visualization is used to show complex relationships between data elements. Some common techniques include:
- Bubble Chart: extends the scatter plot with a third data element represented by size - bubbles.
- Word Cloud: shows the frequency of keywords with text size changing according to importance.
Multidimensional Data Visualization
Used when two or more variables need to be represented, usually in 2D or 3D images. Common examples include bar charts, pie charts, and stacked bar charts.
- Pie charts: show the proportions of components in a whole, such as the revenue structure by product line.
Visualizing geospatial data
Common visualizations include heatmaps, density maps, or terrain maps. For example, businesses can visualize customer traffic data for each branch on a map, making it easy to identify areas with the best performance.
Important Considerations When Visualizing Data
To visualize data effectively, it is important to not only choose the right method but also follow best practices. Here are three important factors to keep in mind:
Design Elements
Creatively incorporating elements such as color, shade, icon, or shape can help highlight important information. For example, in a report on water consumption, you might use a water drop icon instead of a dry column of numbers. This not only makes the data more visually interesting but also helps viewers remember the information.
Comprehensive Evidence
Analyzing large datasets increases reliability and reduces bias. Comprehensive data also helps to detect important outliers. Additionally, you can add summary reports or aggregated data presentations to help viewers get a big picture view before diving into specific details.
Relevant Comparisons
Comparisons help reinforce your point and make it more convincing. For example, when testing a new business idea, you can visualize the before and after data to illustrate the dramatic change. This not only provides visual context, but also helps viewers see the potential for future improvements.

Challenges of Implementing Data Visualization
If not implemented properly, data visualizations can be misleading, lose their value, or even be misused to reinforce false conclusions. Here are three of the most common challenges:
Oversimplifying data
The goal of visualization is to make data easier to understand, but if too much detail is removed, important factors can be missed. For example, a report shows that academic performance is declining and students are playing more video games. If the simple bar chart is used alone, viewers can easily conclude that video games are the main cause of poor academic performance.
Human bias
Data itself is objective, but data visualization is subject to human bias. Reporters can unintentionally (or intentionally) select, clean, or present data in ways that reinforce their own views. When using modern data visualization tools, the final results can still be biased if the team lacks diversity in perspectives. Therefore, to limit this risk, organizations should build diverse teams and apply a peer review process before publishing data reports.
Data exaggeration
This is a dangerous practice because it can lead to wrong decisions or be exploited for non-transparent purposes. For example, a team may justify the purchase of expensive equipment by presenting a visual report showing increased worker safety after installation. However, in reality, many other factors such as training processes or improved safety standards are the main cause, not the equipment.

Things to Consider When Choosing Data Visualization Software
To get the most out of your data, choosing the right data visualization software is key. There are many free and paid tools on the market, and choosing the best solution depends on your organization's specific needs. Here are some important factors to consider:
Infrastructure Support
Data visualization software should integrate seamlessly with your company's existing IT infrastructure, including internal databases, ERP systems, CRM software, or Cloud Storage. The tool should also support third-party data sources, allowing you to easily import external data when you need to do extensive analysis.
Interactive Reporting
This feature makes it easy for non-technical users to manipulate data: filter, sort, change variables, or directly observe changes in the chart. With interactive reporting, departments can proactively seek insights without relying entirely on the technical team, thereby improving the efficiency of big data analysis.
Security
Data is an important asset of the business. The tool you choose should integrate strong security features, such as user authorization, role-based access control, data encryption, and activity log tracking. This will help limit the risk of leakage or unauthorized access to the business intelligence system.
Scalability
Businesses today not only analyze structured data but also have to work with unstructured data from social networks, IoT sensors, or multi-channel customer data. Therefore, you should prioritize data visualization tools with machine learning (ML) and artificial intelligence (AI) capabilities to automate analysis, predict trends, and optimize reports at scale.

Real-Time Business Use Cases for Data Visualization
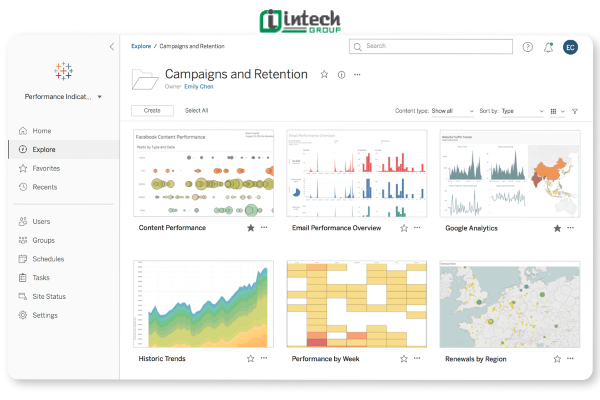
When provided with accurate and timely context, stakeholders can better understand performance and quickly adjust strategies. A business dashboard is a great example: it aggregates and visualizes data to track key KPIs, ensuring that decisions are based on the latest data.
Business
In business, data visualization helps businesses evaluate the effectiveness of distribution channels, products, and sales strategies. By aggregating data from multiple tools and sources, businesses gain a comprehensive view of their operations. For example, a visual sales dashboard shows revenue by region, the performance of each sales team, or the success of a promotional campaign.
Marketing
Visual forms such as conversion rate charts, customer engagement levels or user behavior on the website help managers quickly assess the impact of each initiative. Not only that, visual reports can be easily shared among stakeholders, ensuring that everyone grasps the updated data and synchronizes timely actions.
Finance
In the financial sector, data visualization brings great advantages in analysis, planning and forecasting. Instead of having to synthesize and process complex spreadsheets, businesses can quickly observe cash flow, costs, profits and risk levels through dynamic charts. This not only saves time in data preparation, but also supports financial managers to make timely decisions to respond to market fluctuations or economic instability.
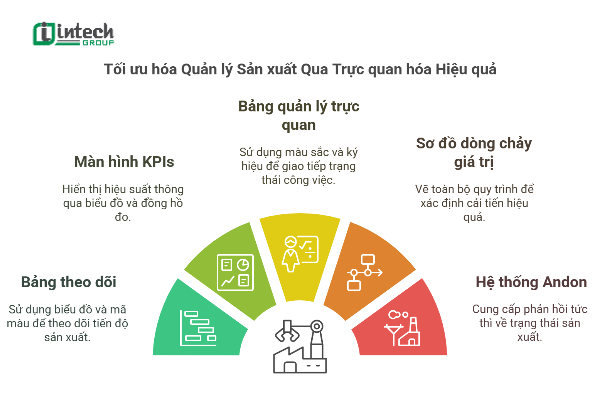
Visualization in production not only helps businesses optimize operational efficiency, control quality and minimize risks, but also opens up opportunities to improve competitiveness in the era of industry 4.0. To successfully implement, businesses need to choose the right solution and an experienced partner. Intech Group, a pioneer in the field of automation and production visualization, is proud to bring comprehensive solutions, helping businesses optimize management, improve productivity and be ready to break through in the market. Contact us immediately via hotline for advice and support.