


What is a Flowchart? Symbols in a Flowchart
18-10-2025 192
A flowchart is a diagram that uses shapes and arrows to describe the steps in a process or algorithm, helping users easily visualize and understand the process, thereby optimizing and improving work efficiency.
What is a Flowchart?
A flowchart is a useful visual tool that illustrates the sequence of activities required to achieve a desired result. Also known as a process flow diagram, it is a type of diagram that represents an algorithm, workflow, or sequence of actions.
According to Wikipedia, a flowchart represents the steps of a process as different boxes, connecting them with arrows to show the order of execution. This not only makes it easy for users to track the necessary steps but also identifies the relationships and processes between them.

Process flow diagrams are widely used in many fields, including analysis, design, documentation, and workflow management. By using the diagram, managers and professionals can improve work efficiency, detect bottlenecks in the process, and optimize the implementation steps.
Dr. Edwards Deming once said, “Draw a diagram of anything you do, until you do it, you don’t know what you’re doing, you just have a job.” This quote emphasizes the importance of visualizing the process to better understand the activities and responsibilities of each individual in the organization.
Using flow charts not only helps improve work performance but also facilitates effective communication and collaboration within the team, thereby promoting sustainable development for the organization.
The Role of Flowcharts
Flowcharts are a powerful tool in managing and optimizing workflows. Here are some of the key uses of flowcharts:
1. Planning a new project: Using a flowchart helps you clearly visualize the steps that need to be taken, from project initiation to completion, ensuring that no steps are skipped.
2. Documenting processes: Flowcharts can be used to document current processes within an organization, thereby creating a guide for team members.
3. Managing workflows: Using flowcharts helps track work progress and identify bottlenecks in the process, so that work steps can be adjusted and optimized.
4. Auditing purpose: Flowcharts provide an overview of the processes and steps in an organization, making it easier to check and evaluate the effectiveness of the processes.
Steps to create a Flowchart
When creating a flowchart, pay attention to the following:
- The process should start from top to bottom, from left to right: This makes it easy for viewers to follow and understand the process.
- The size of the graph should be the same: Ensure that all shapes and symbols are of a uniform size to increase aesthetics and readability.
- The start symbol appears only once: This helps viewers identify a clear starting point. However, the end symbol can appear multiple times in the diagram.
- Only one arrow path for the same diagram: Avoids confusion and helps the process to be presented coherently.
- Paths should be avoided: If necessary, slashes should be used on the chart to avoid confusing the viewer.
Using a process flow diagram not only helps to enhance understanding of the process but also improves communication and collaboration within the organization, thereby contributing to the sustainable development of the business.
Symbols used in flowcharts

Oval
- This symbol is used to mark the start and end points in a process, or to represent the beginning and end of a program.
- The oval often uses words like “Start” or “End”, as well as other phrases like “Send Request” or “Receive Product”.
Flow Lines/Arrow Lines
- Flow lines or arrow lines show the order of activities in a process.
- Arrow lines are used to indicate the direction from one symbol to another.
Diamond
- The diamond is used to represent decisions in a process.
- For binary actions like yes/no or true/false, the diamond is the appropriate symbol.
Rectangle
- The rectangle is used to change the value, shape, or position of data in a process.
- To learn about the different symbols, you can refer to the illustration below.
Parallelogram
- A parallelogram is used to represent input and output data in a process.
- It is also used to enter data or display results.
Single Document Diagram
This diagram is used to show a single document (attachment) in any process.
Multiple Document Diagram
This diagram is used to show multiple documents in any process.
Delay Activity
The shape of the delay activity represents the waiting period where no activity takes place.
The symbols in a flow chart not only make it easier to communicate information but also enhance the understanding of the process, thereby improving the efficiency of operations in the organization. To learn how to use different symbols and see examples, please refer to the illustration below.
Flowchart Example
Different types of flowcharts
– Macro.
– Mini.
– Matrix flowchart.
Some important notes for drawing an effective Flowchart
Flowchart is a visual tool that helps describe a process or algorithm clearly and easily. To draw an effective Flowchart, you need to pay attention to the following factors:
1. Clearly define the purpose of the Flowchart
Before starting, you need to clearly define what process the Flowchart will be used to describe and what audience it will serve. This helps ensure that the flowchart is logical and easy to understand.
2. Use standard symbols
Flowchart has standard symbols such as oval (start/end), rectangle (process), diamond (branch condition)... Using the correct standard helps readers easily access and apply it in practice.
3. Arrange the steps in a logical order
The steps in the Flowchart should be arranged sequentially, following the natural processing flow from top to bottom or from left to right. This makes it easy for the viewer to follow and avoid confusion.
4. Make use of colors and lines to distinguish
Colors and line thickness can be used to highlight important steps, making the Flowchart easier to read and more intuitive. However, they should be used reasonably to avoid confusion.
5. Group steps and use reasonable titles
If the Flowchart is too complex, it is advisable to group the steps into small sections with titles to make it easier for the reader to understand. This is especially useful in processes with many stages or complex branches.
Examples of different diagrams are mentioned in the figures below
Macro and mini flowchart
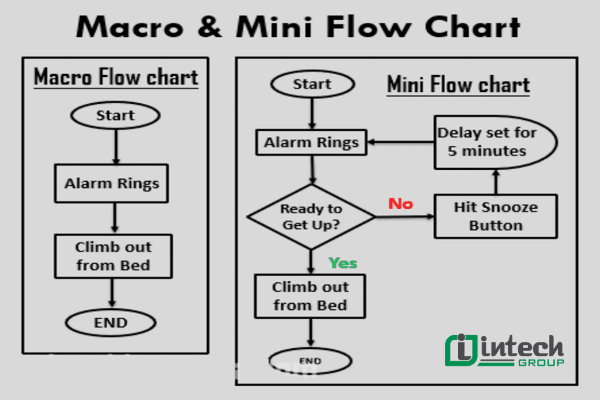
Macro Flowchart & Mini Flowchart
Matrix flowchart
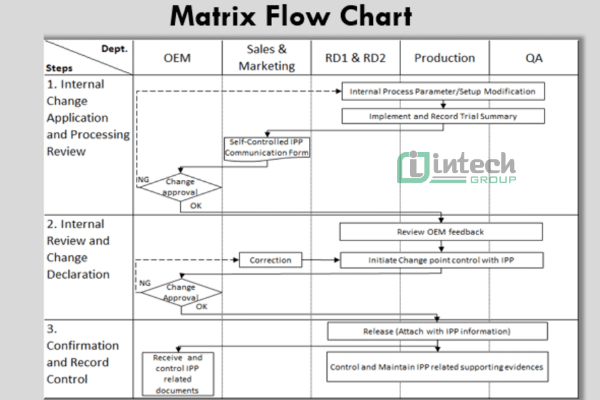
Matrix Flow-chart
Benefits of Using FlowCharts
Improve Process Understanding
Flowcharts help visualize the steps in a process, thereby improving understanding of how they work and the relationships between them. This helps team members master the process and avoid confusion.
Provide a Training Tool
Using flowcharts as training materials helps new employees easily access and understand complex processes. Visual images enhance retention and promote rapid learning.
Identify Problem Areas and Improvement Opportunities
By looking at flowcharts, managers can easily identify bottlenecks in the process, thereby providing effective improvement solutions. This diagram also helps detect opportunities to optimize the process, improving work performance.
Identify and analyze processes easily
Flowcharts allow for systematic process analysis, helping managers better understand how the current process works. This is crucial for making informed decisions about process improvement.
Flowcharts are visual tools widely used in both large and small businesses to describe the steps in a workflow in an easy-to-understand and vivid way. Thanks to their illustrative capabilities, Flowcharts help users have a clear and comprehensive overview of how the process operates in the business, thereby supporting performance optimization and improving project management. In the context of increasingly developing technology and business processes, understanding and mastering Flowcharts will become an advantage, helping you improve efficiency and achieve success in all fields.
See more: